This package contains a simple wrapper function, pdplot2 which visualizes probability density/mass and cumulative distribution functions provided in R using ggplot2. The available PDFs & CDFs include the following: normal, logistic, binomial, chi-square, poisson, exponential, cauchy, beta, gamma, geometric, Student's t, F, Weibull, negative binomial, log-normal, uniform, and hypergeometric.
Installation
install.packages(devtools)
devtools::install_github("tegedik/pdplot2")
Usage
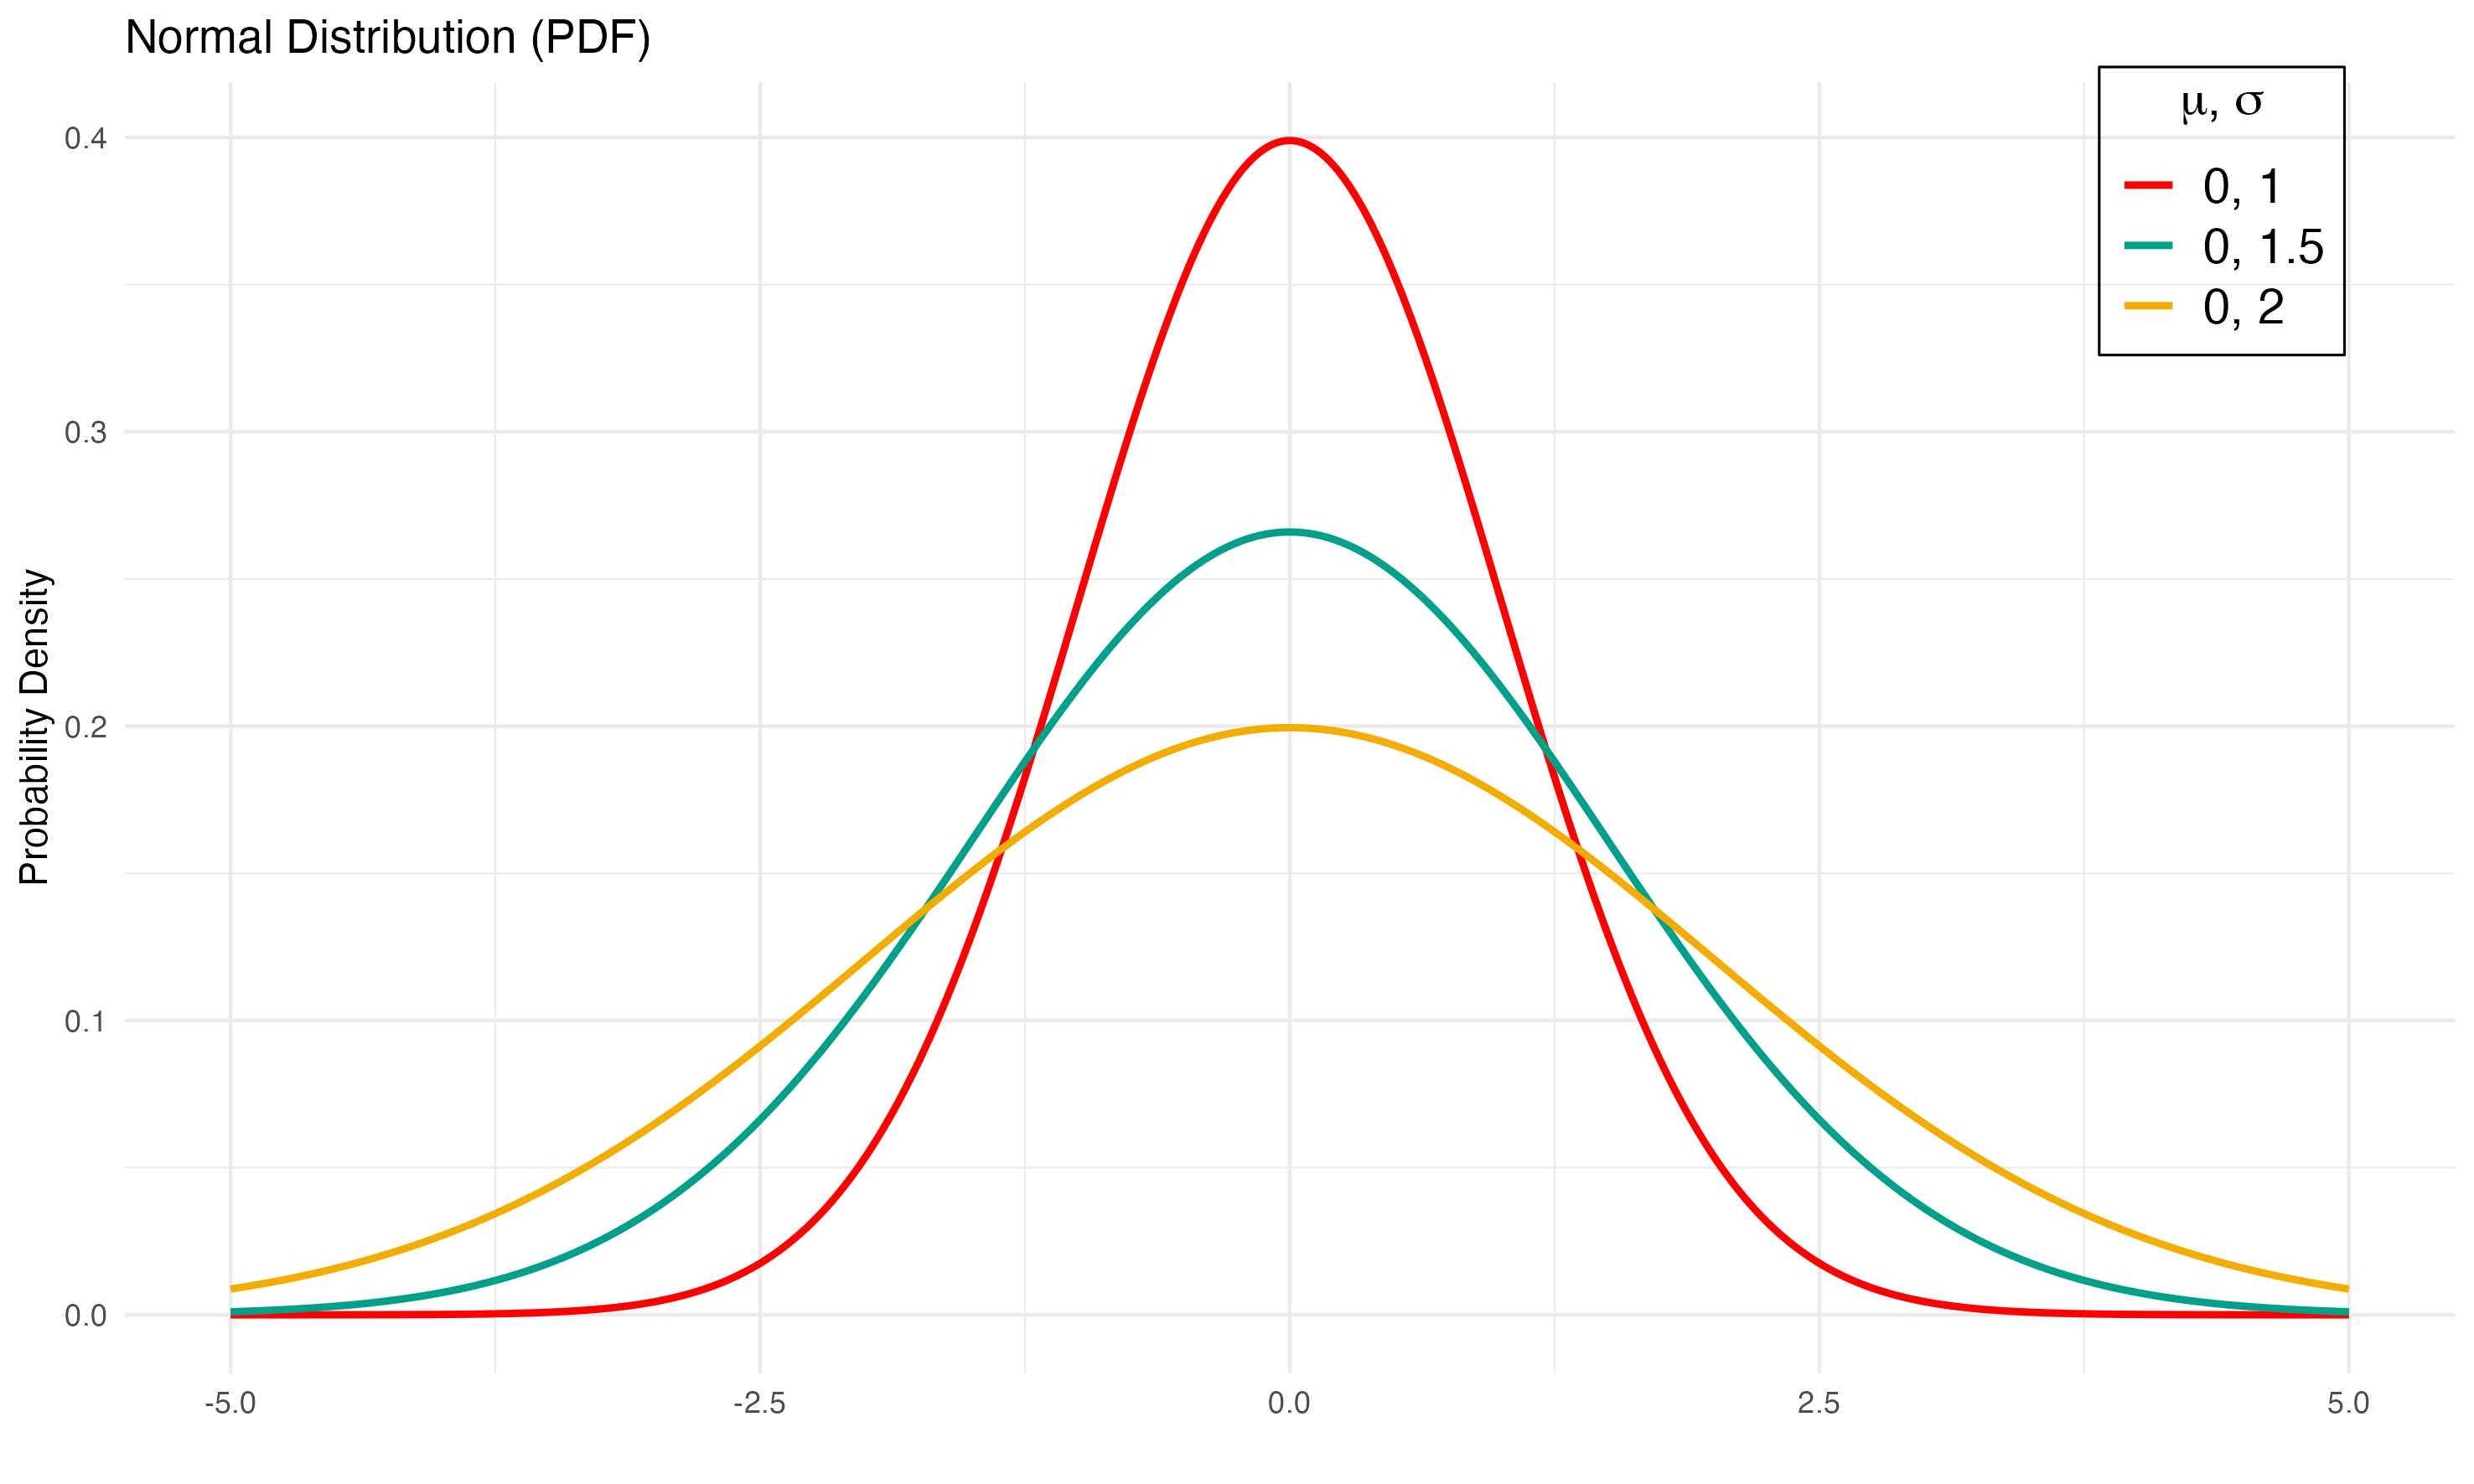
pdplot2 follows the convention of density distributions in R. First, you need to create a vector of quantiles and pass it as the first argument in the function. Then, you need to select the correct parameter(s) for each distribution (e.g., mean, sd). Afterwards, you need to specify the probability distribution (e.g., dist="normal"). Finally, you choose between probability density or cumulative distribution functions (e.g., type="PDF"). Here is an example with normal distribution,
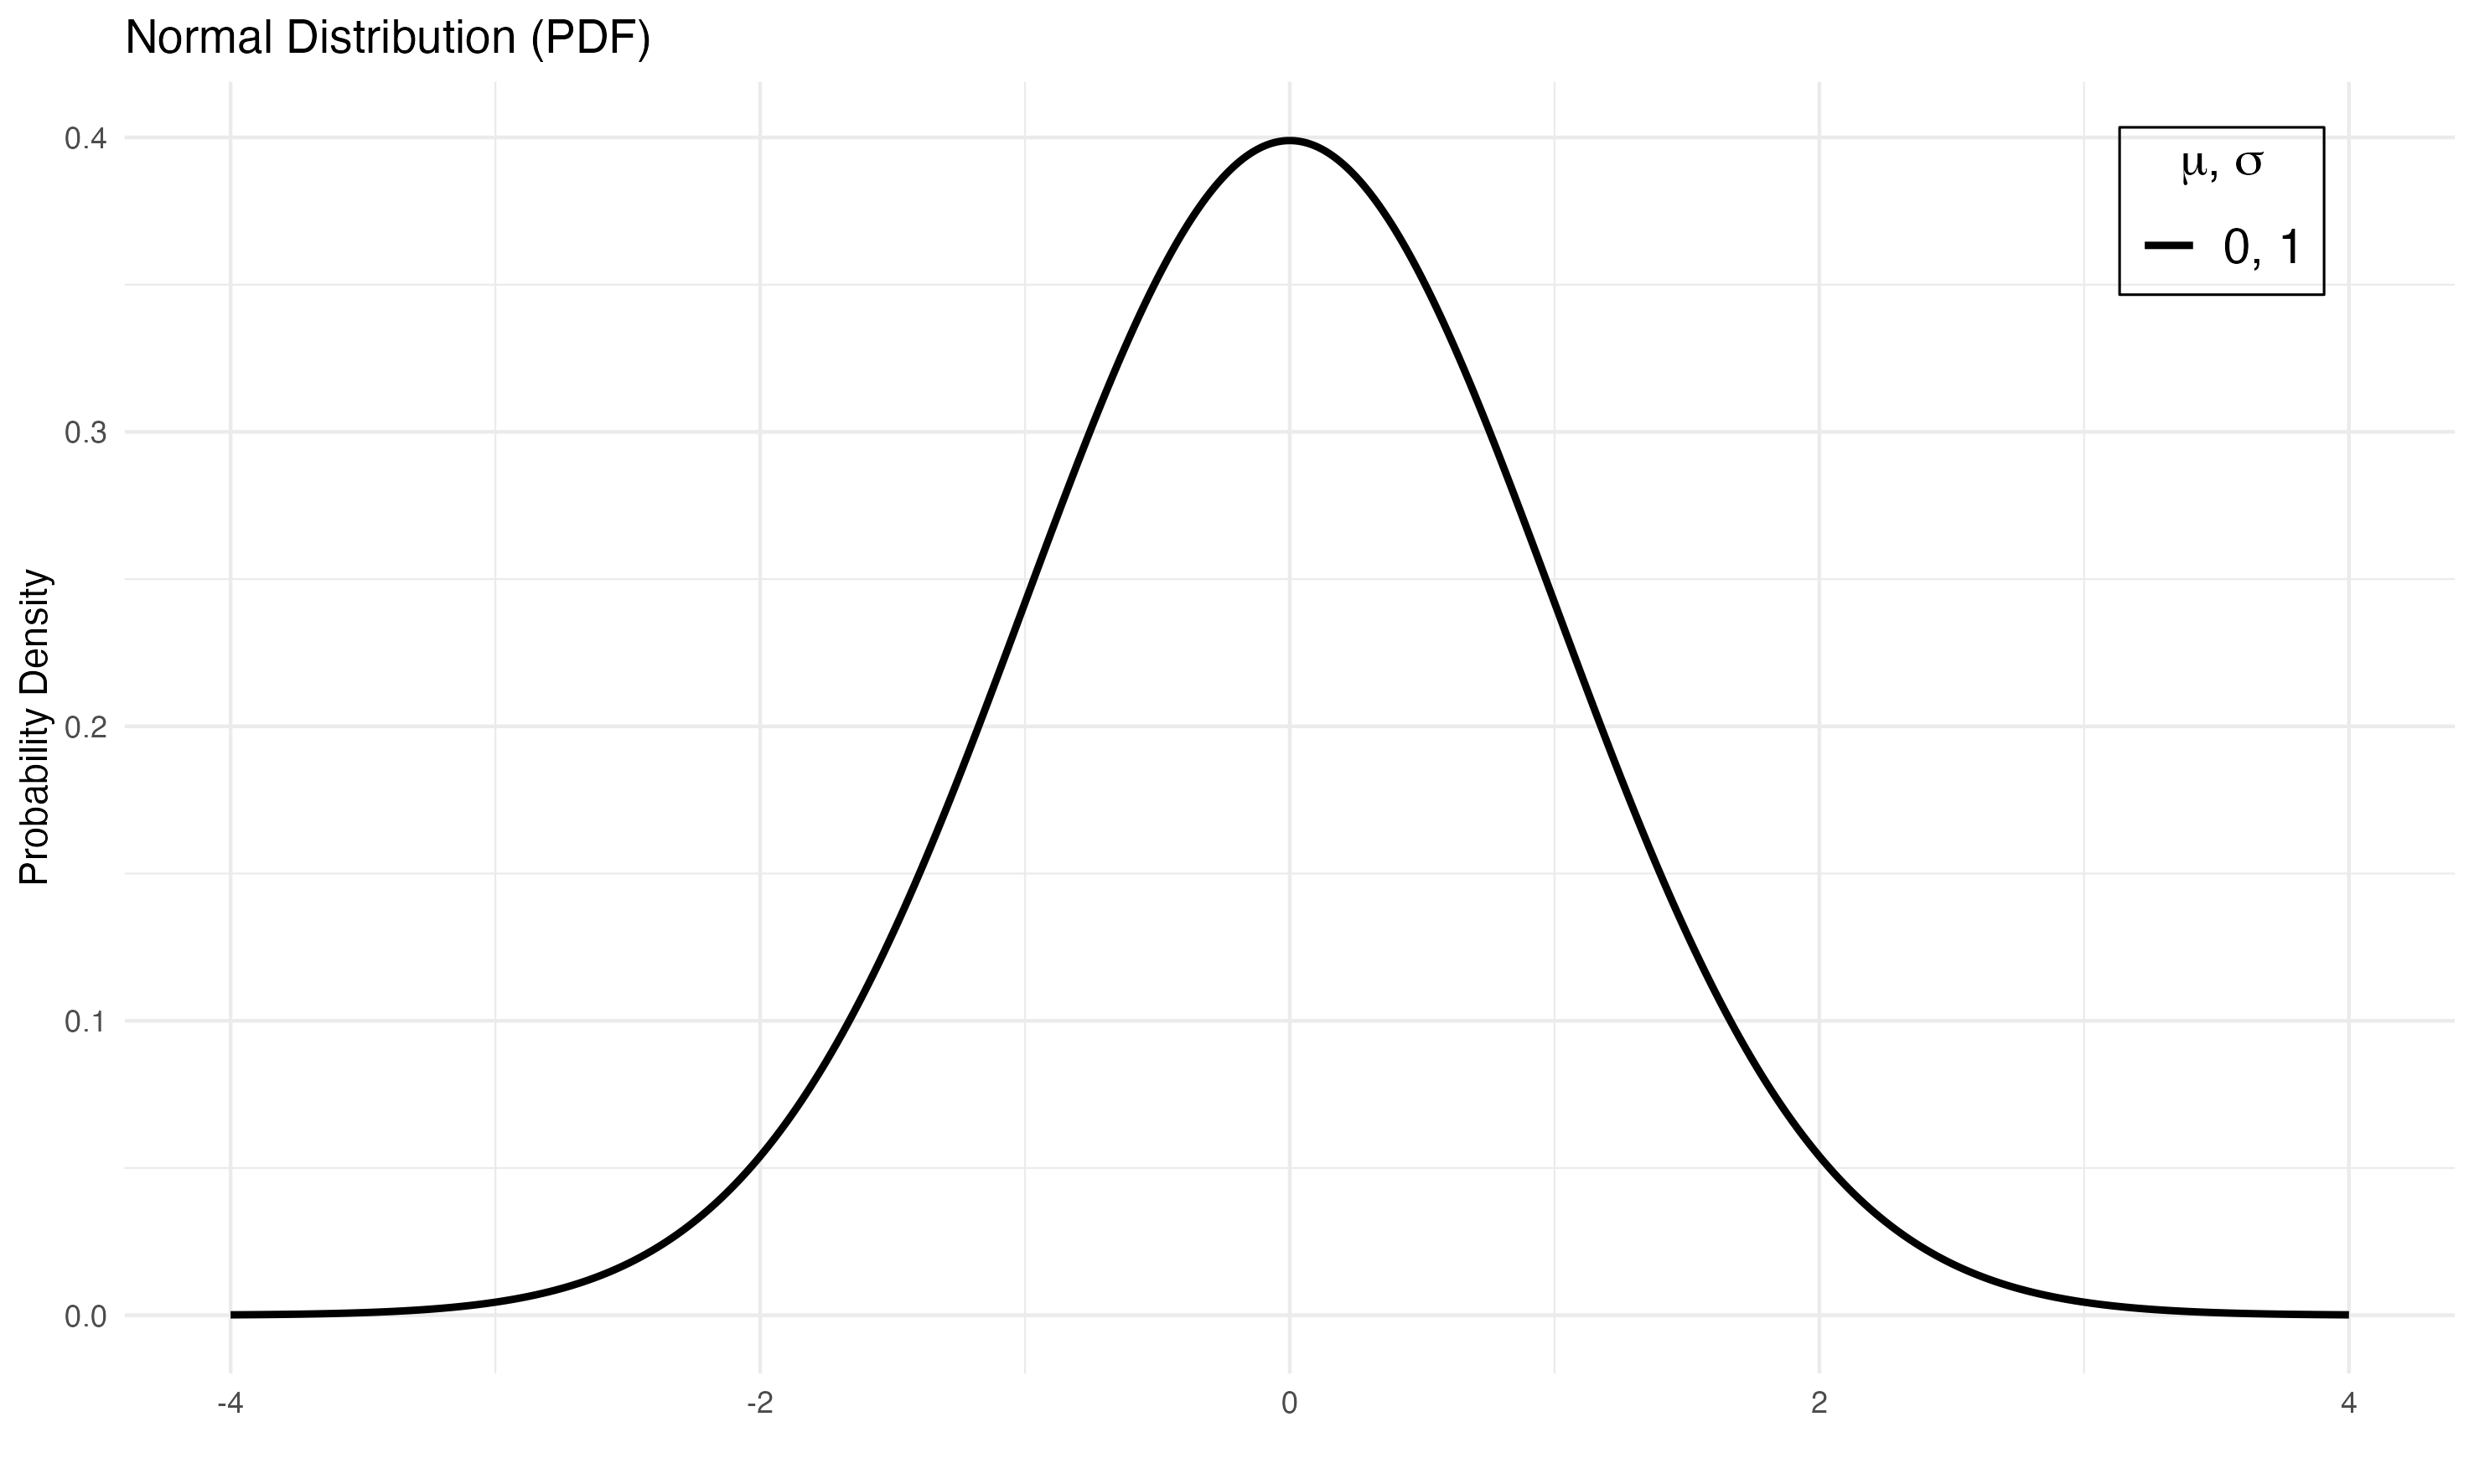
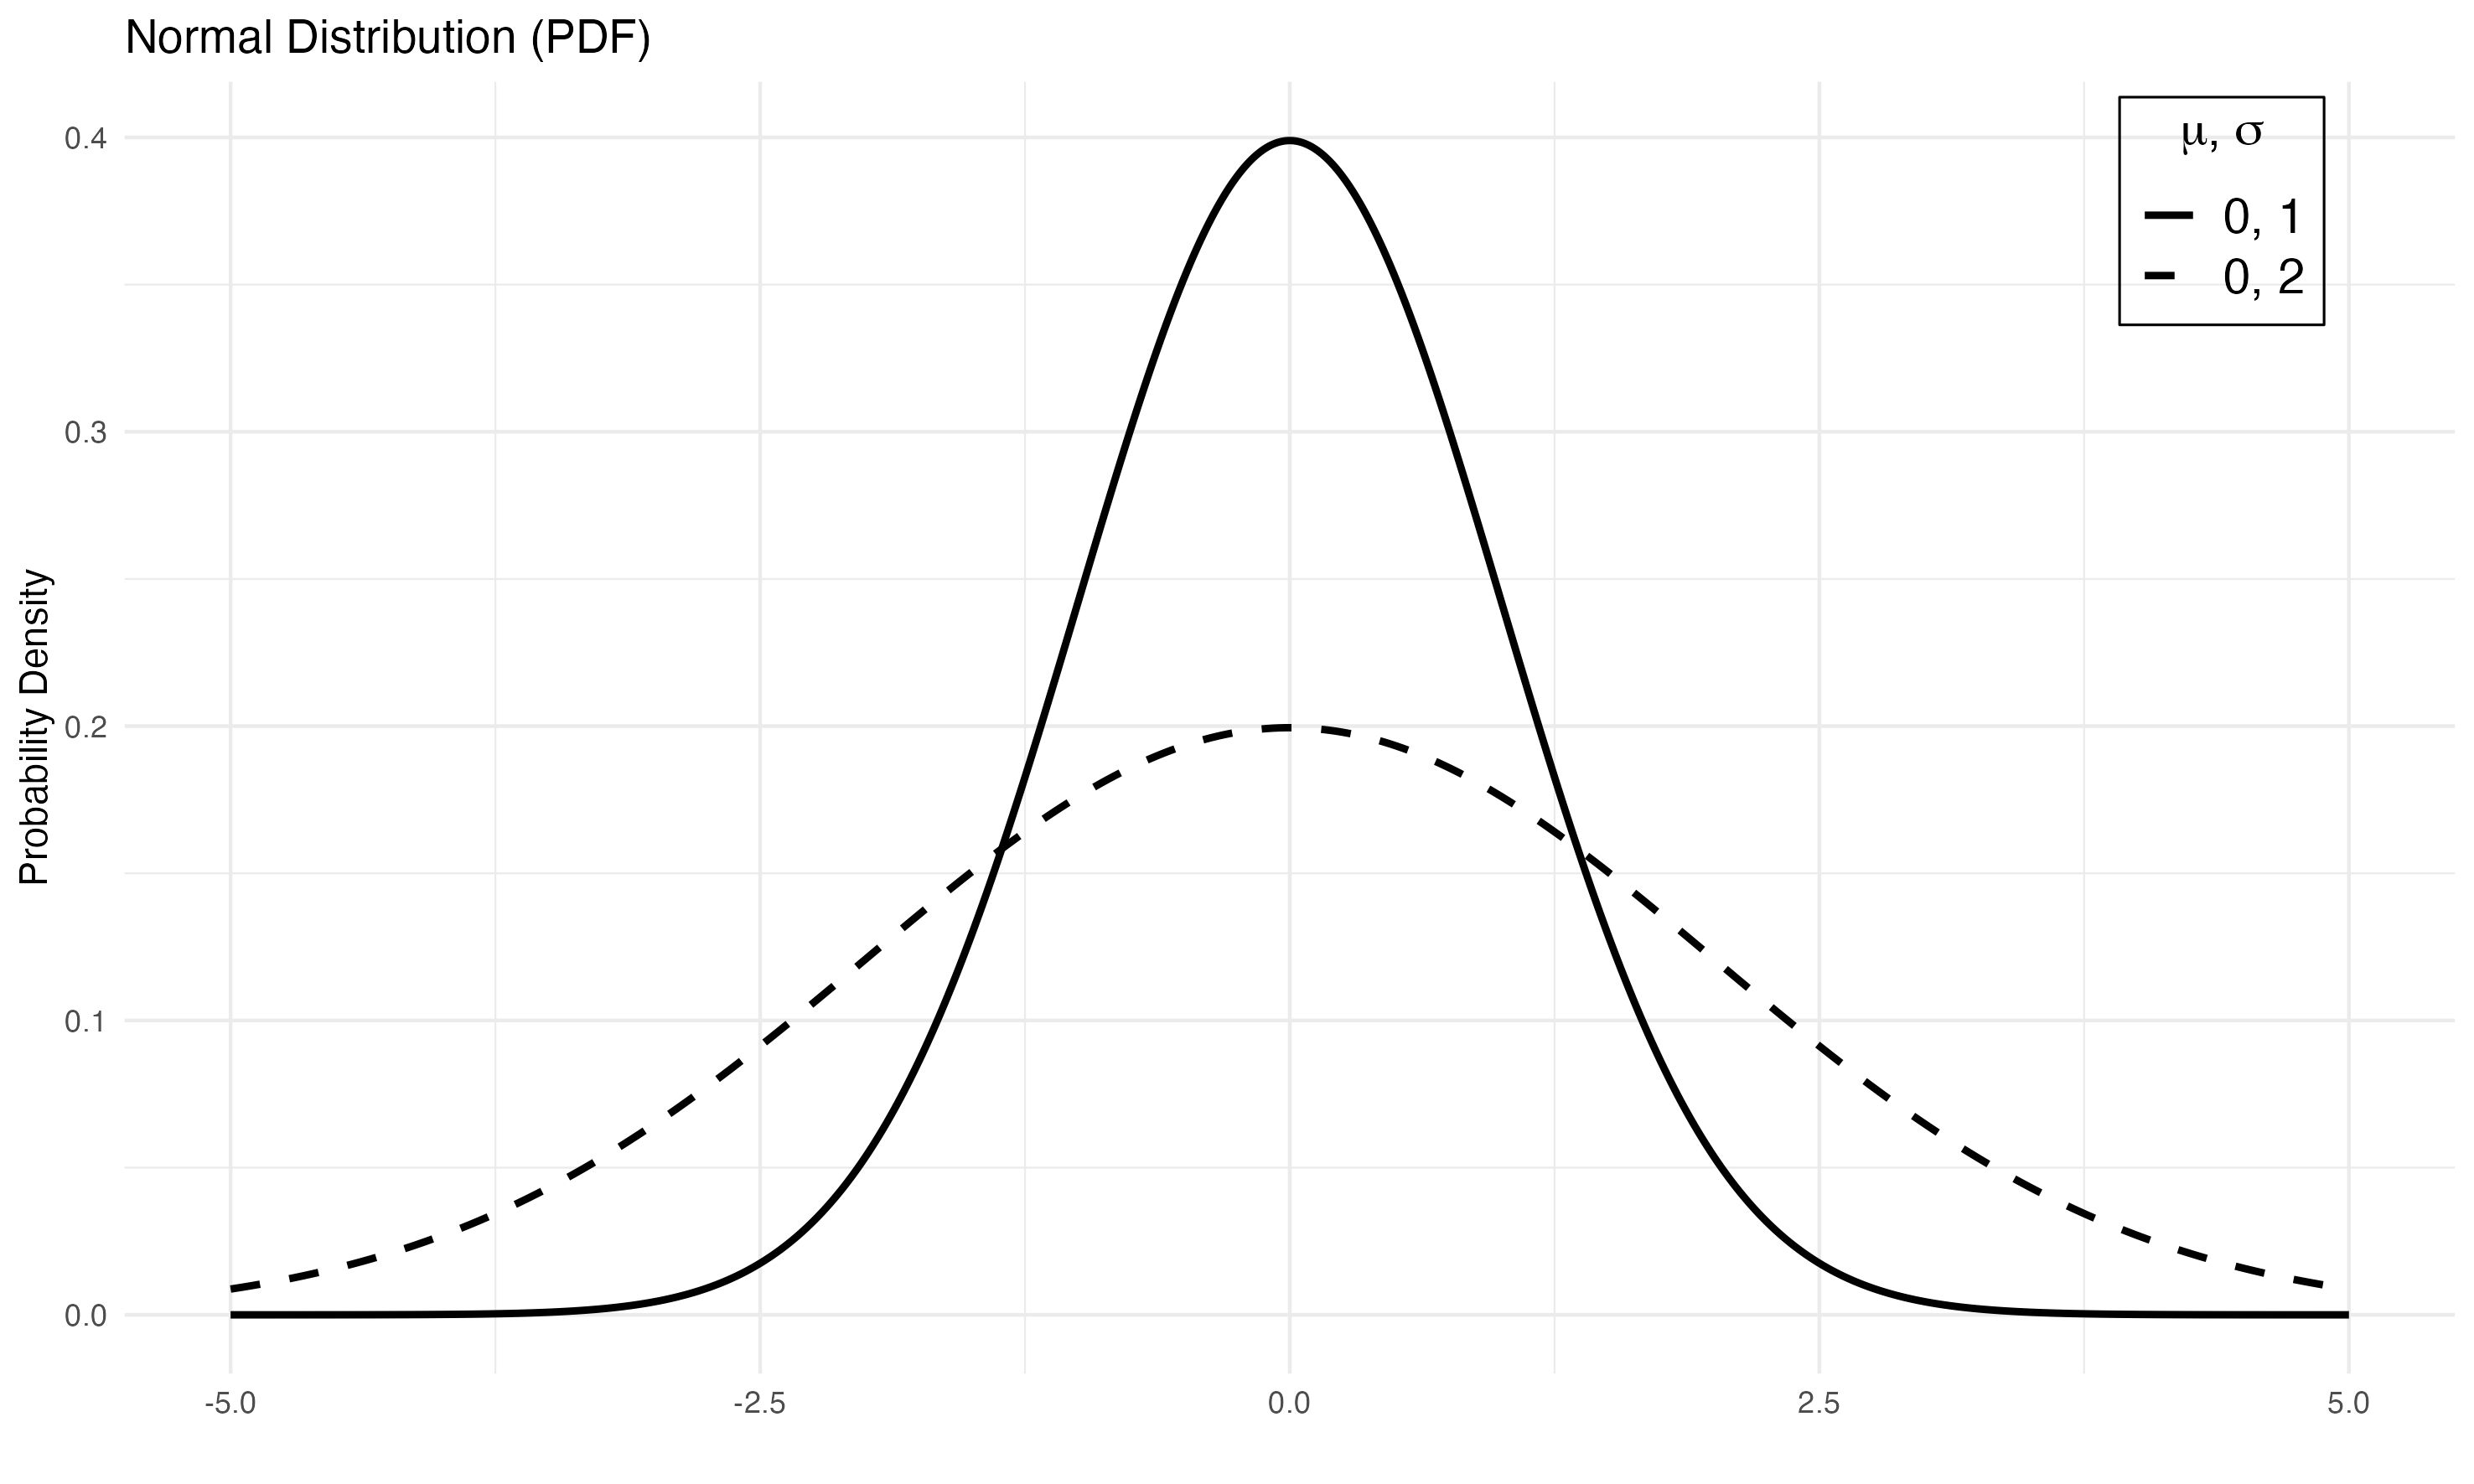
This will create a normal probability distribution with mean 0 and sd 1. You can pass vector of parameter values as argument to plot multiple density curves.
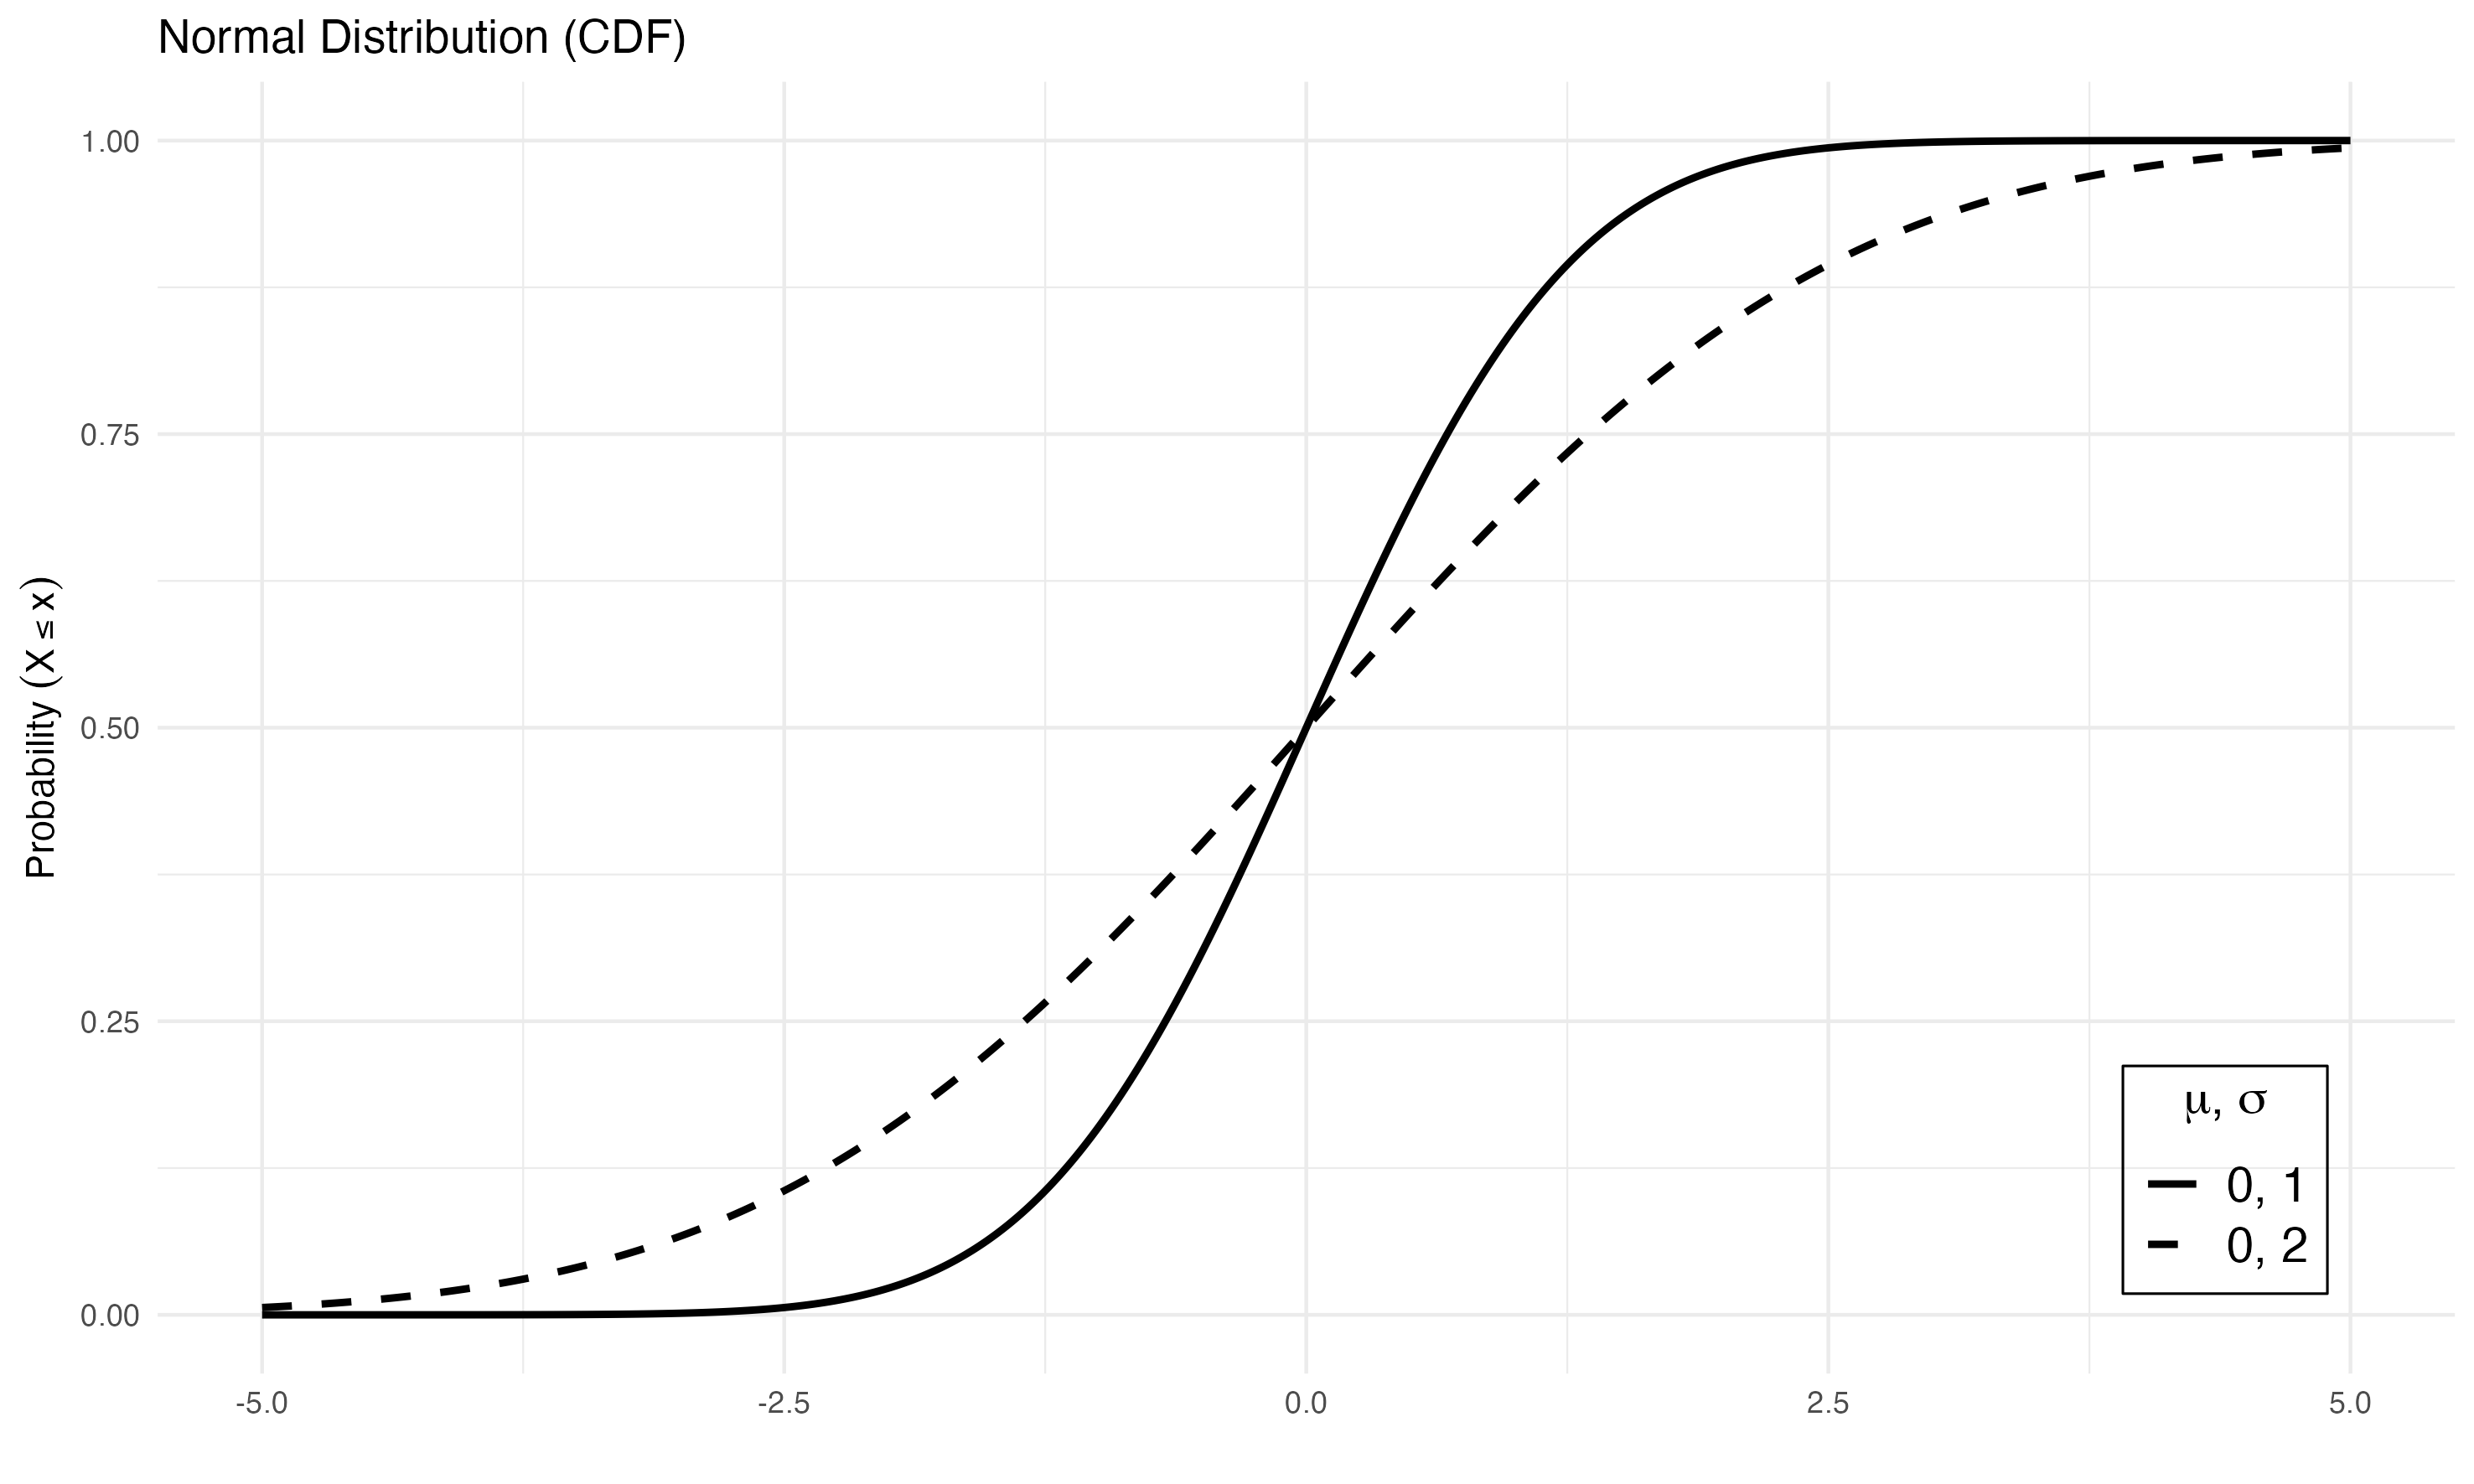
If you use type="CDF", the function will return a cumulative distribution function:
Changing Linetypes
You might want to change the default line types. To accomplish this, you can pass a character vector containing types to linetype.
pdplot2(0:20, lambda=6:9, dist="poisson", type="PDF",
        linetype=c("solid", "dashed", "dashed", "dashed"))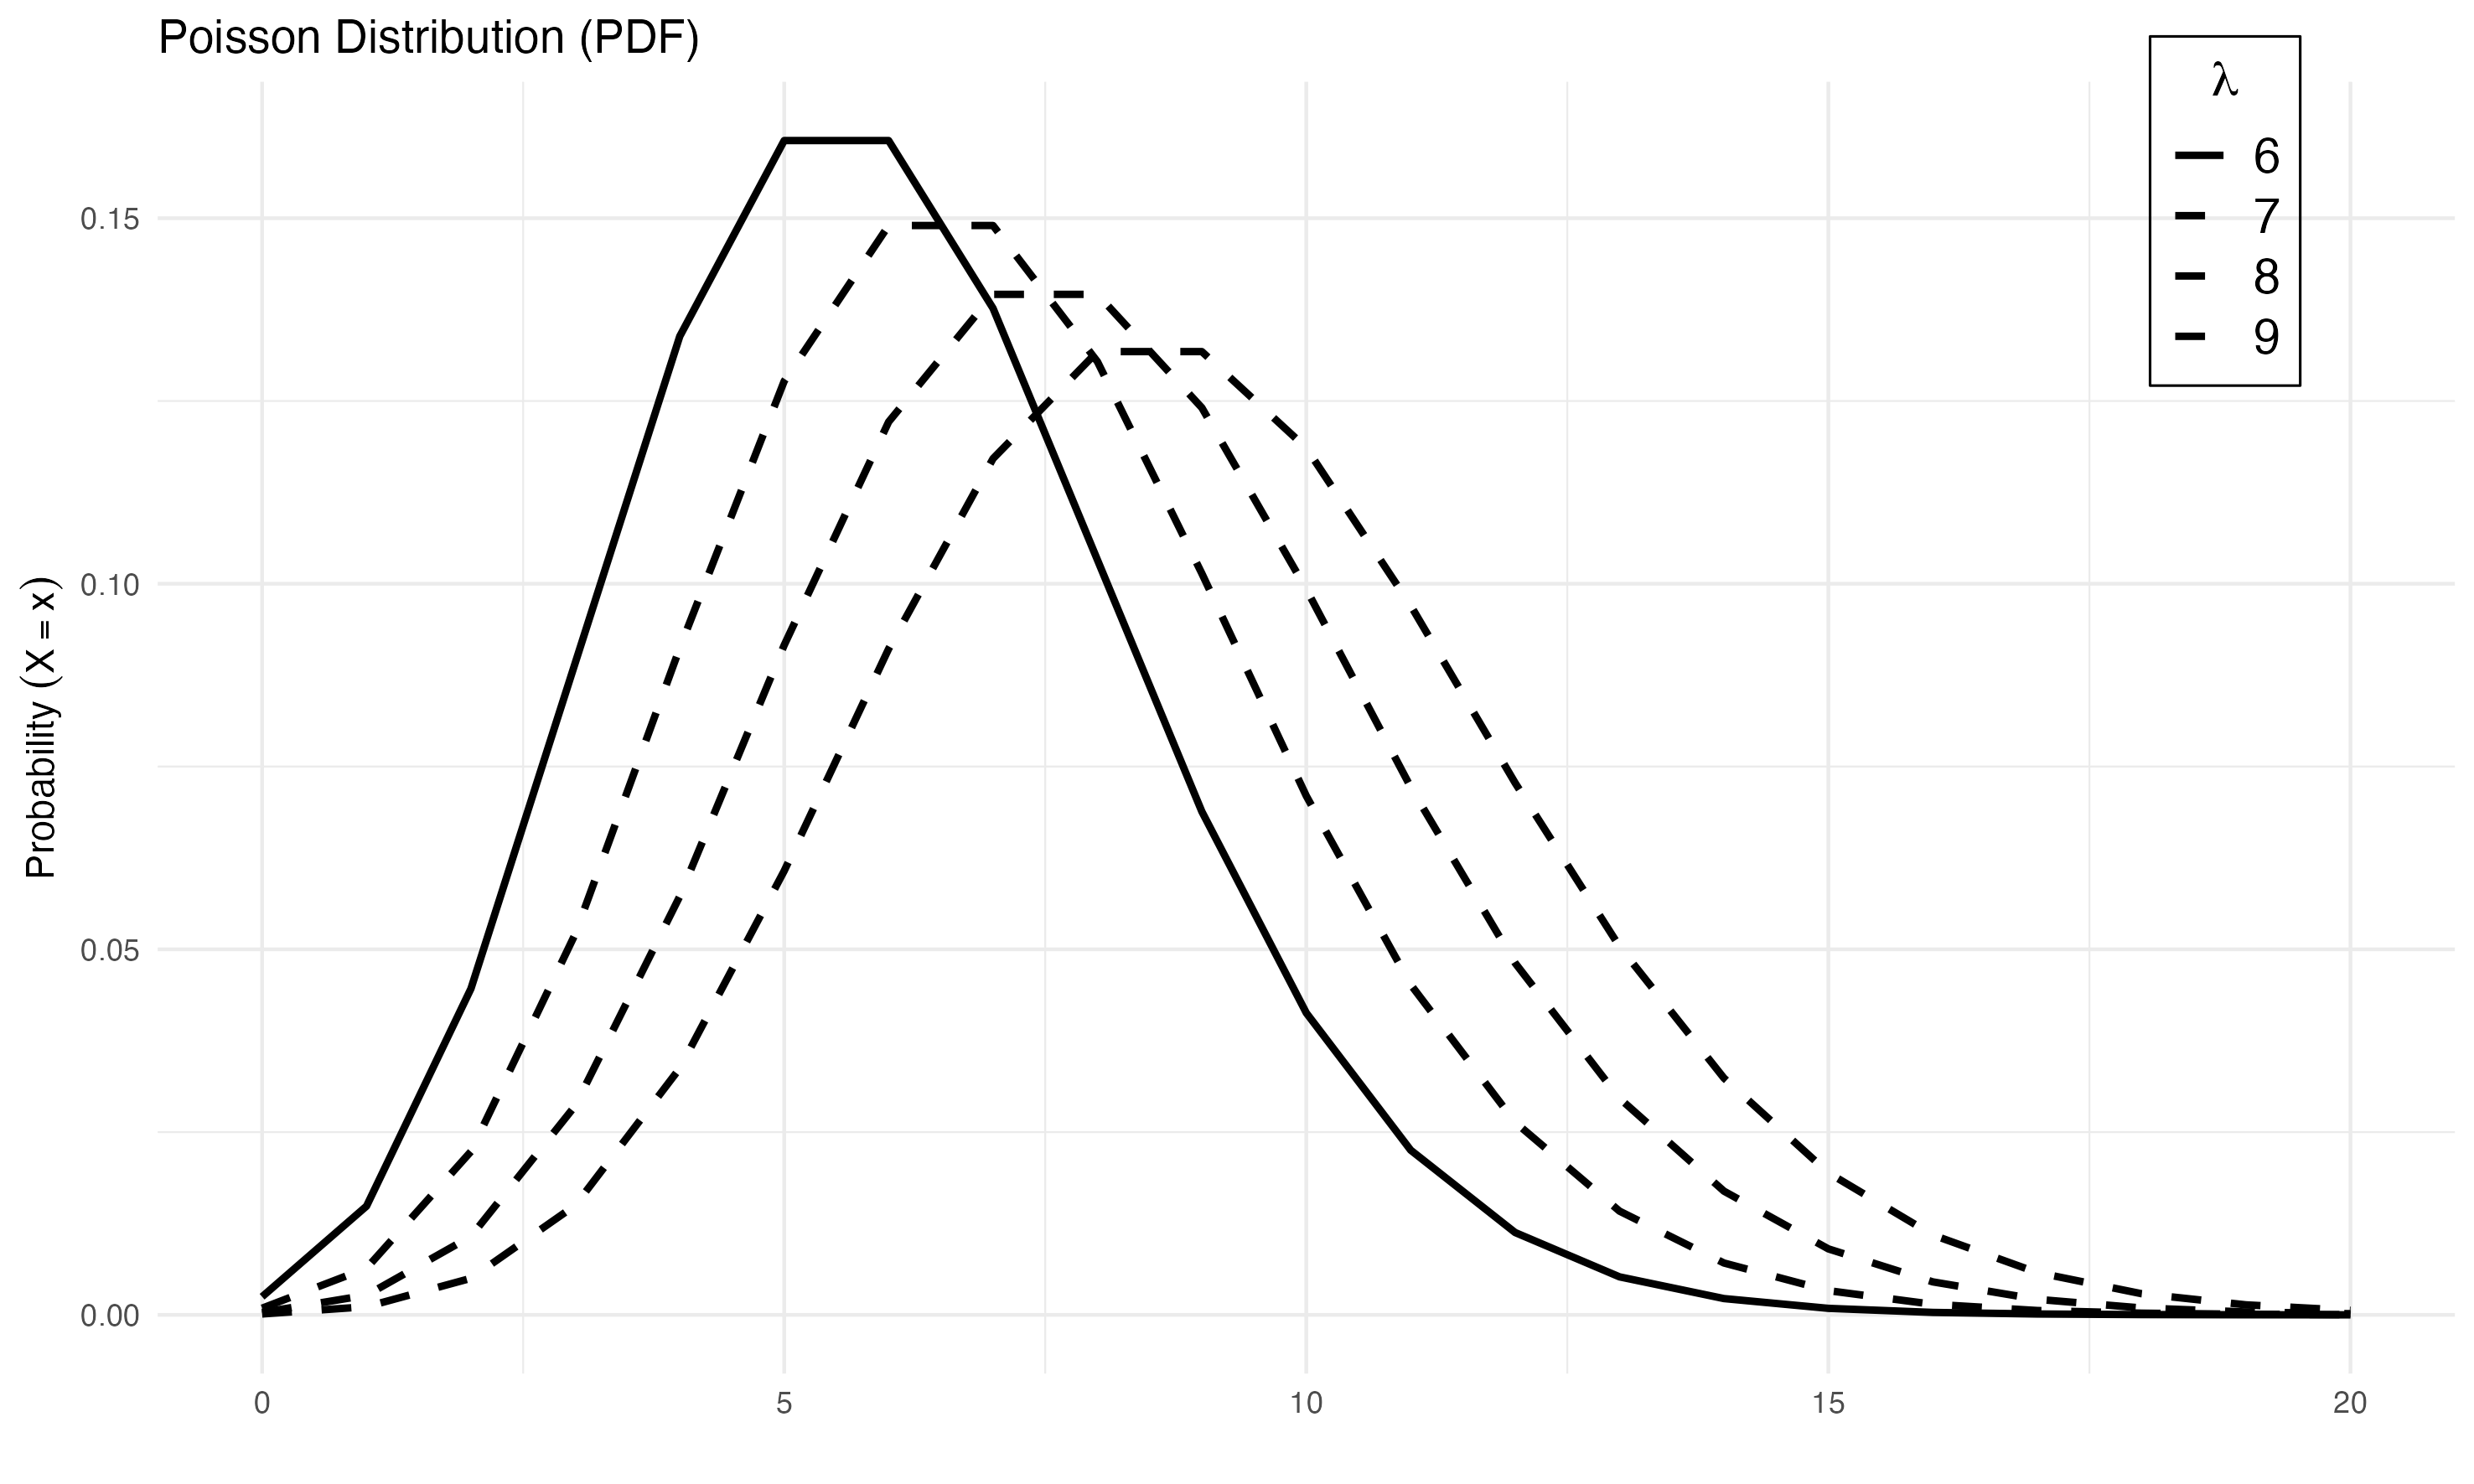
Colors
You might also prefer colored plots. To show colors instead of linetypes, you need to specify show_color=TRUE.
As in the case of line types, you can change colors. You need to set color_selection=TRUE and then pass a character vector to color.
pdplot2(seq(-5, 5, 0.01), mean=c(0,0,0), sd=c(1,1.5,2), dist="normal", type="PDF",
              show_color=TRUE, color=c("black", "blue", "green"))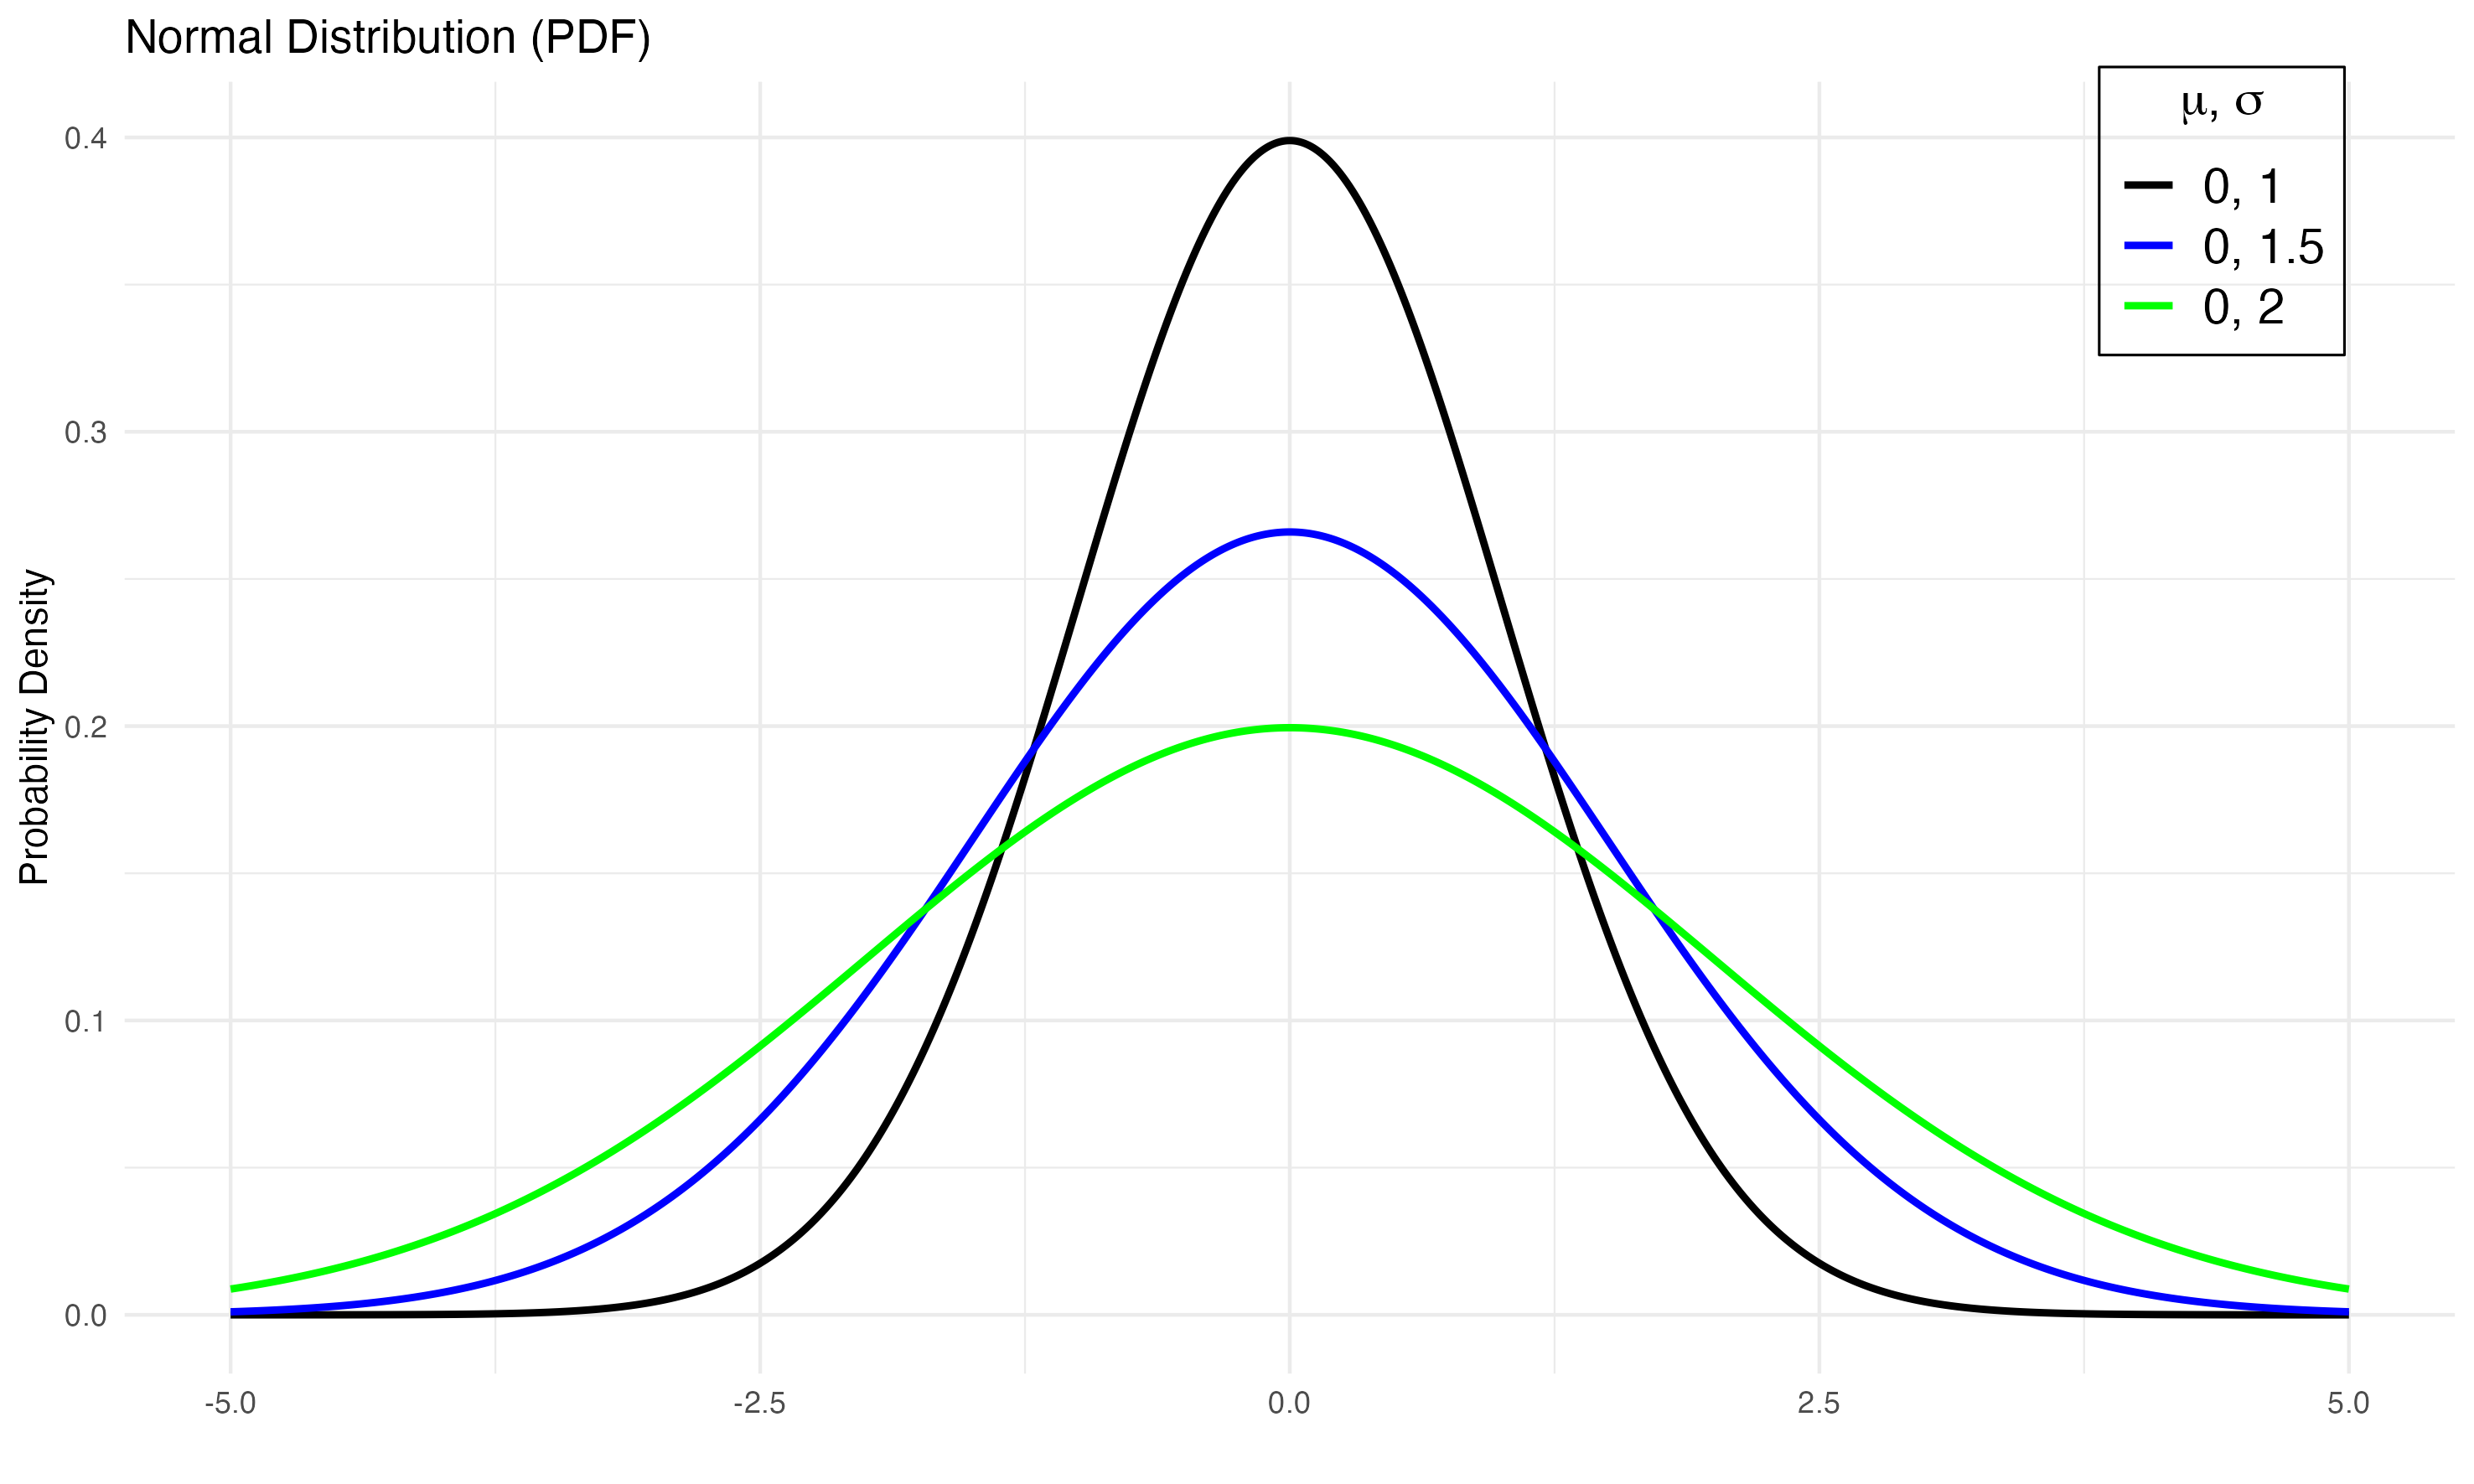
Editing Plots
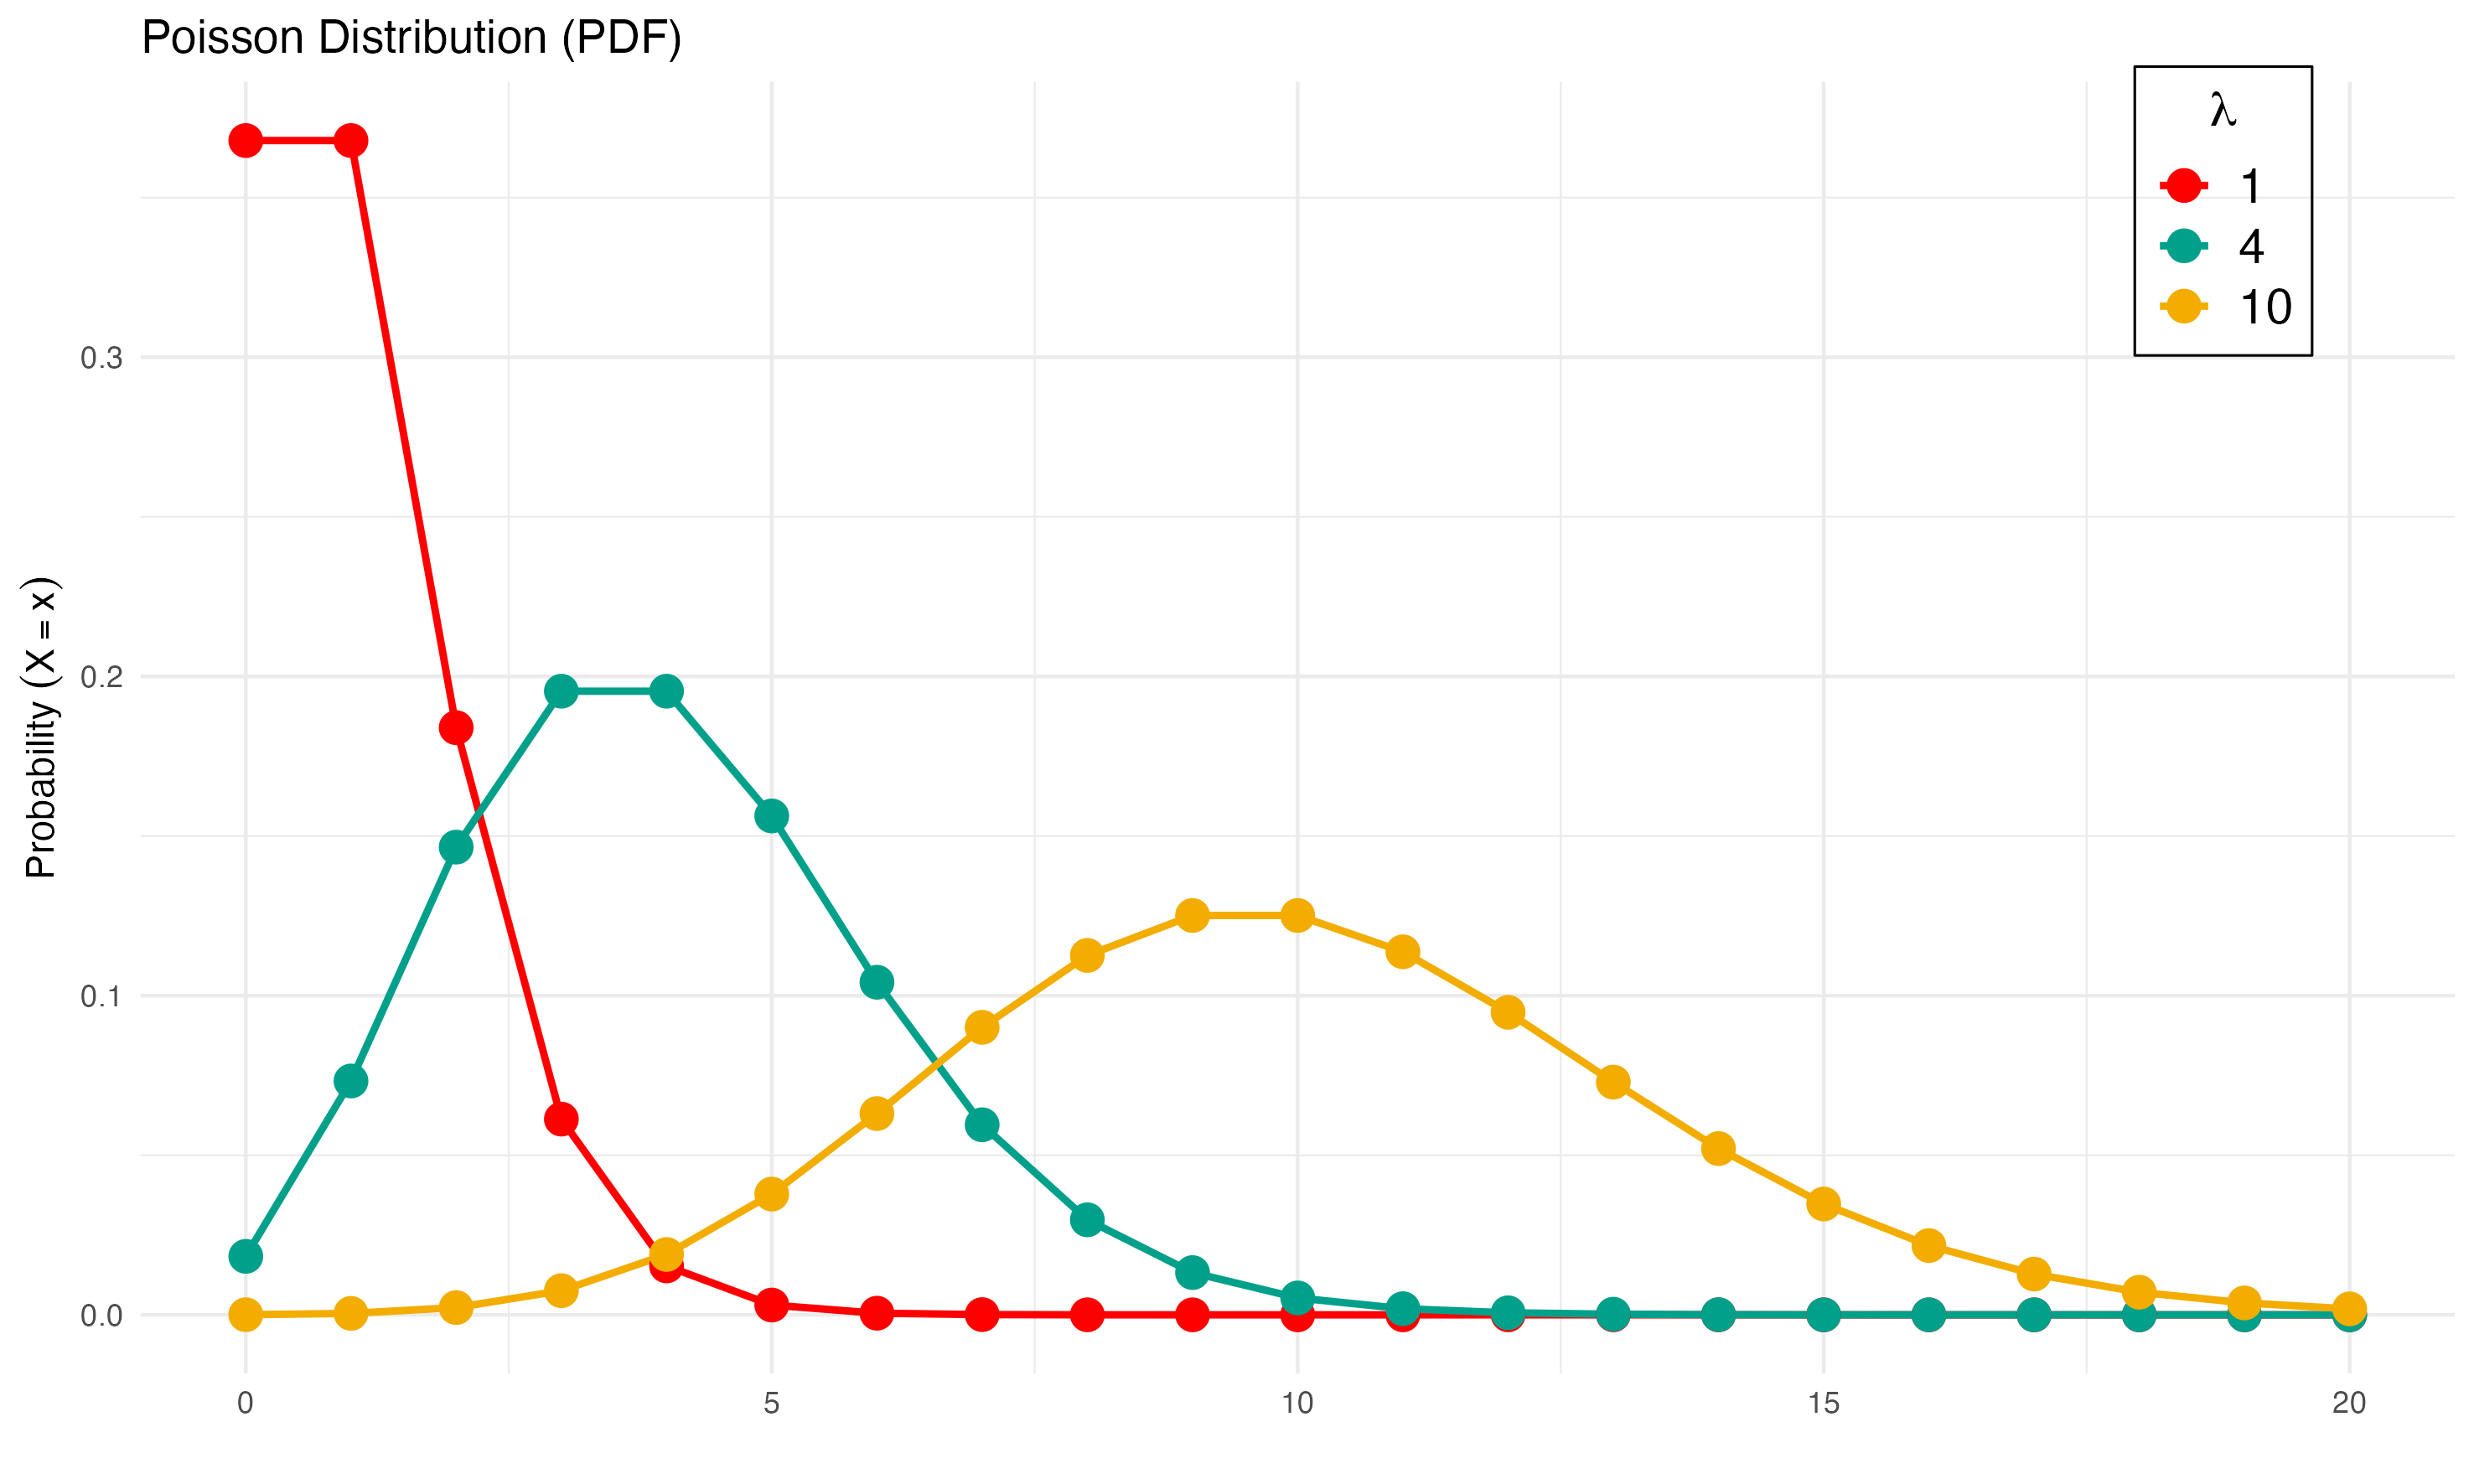
Since pdplot2 runs ggplot2 and creates ggplot2 objects, you can edit plots using ggplot2 functions. For example, after plotting discrete distributions, you might want to add points (see this wiki page for Poisson distribution).
References
Guangchuang Yu (2020). hexSticker: Create Hexagon Sticker in R. R package version 0.4.9. https://CRAN.R-project.org/package=hexSticker
H. Wickham. ggplot2: Elegant Graphics for Data Analysis. Springer-Verlag New York, 2016.
Karthik Ram and Hadley Wickham (2018). wesanderson: A Wes Anderson Palette Generator. R package version 0.3.6. https://CRAN.R-project.org/package=wesanderson