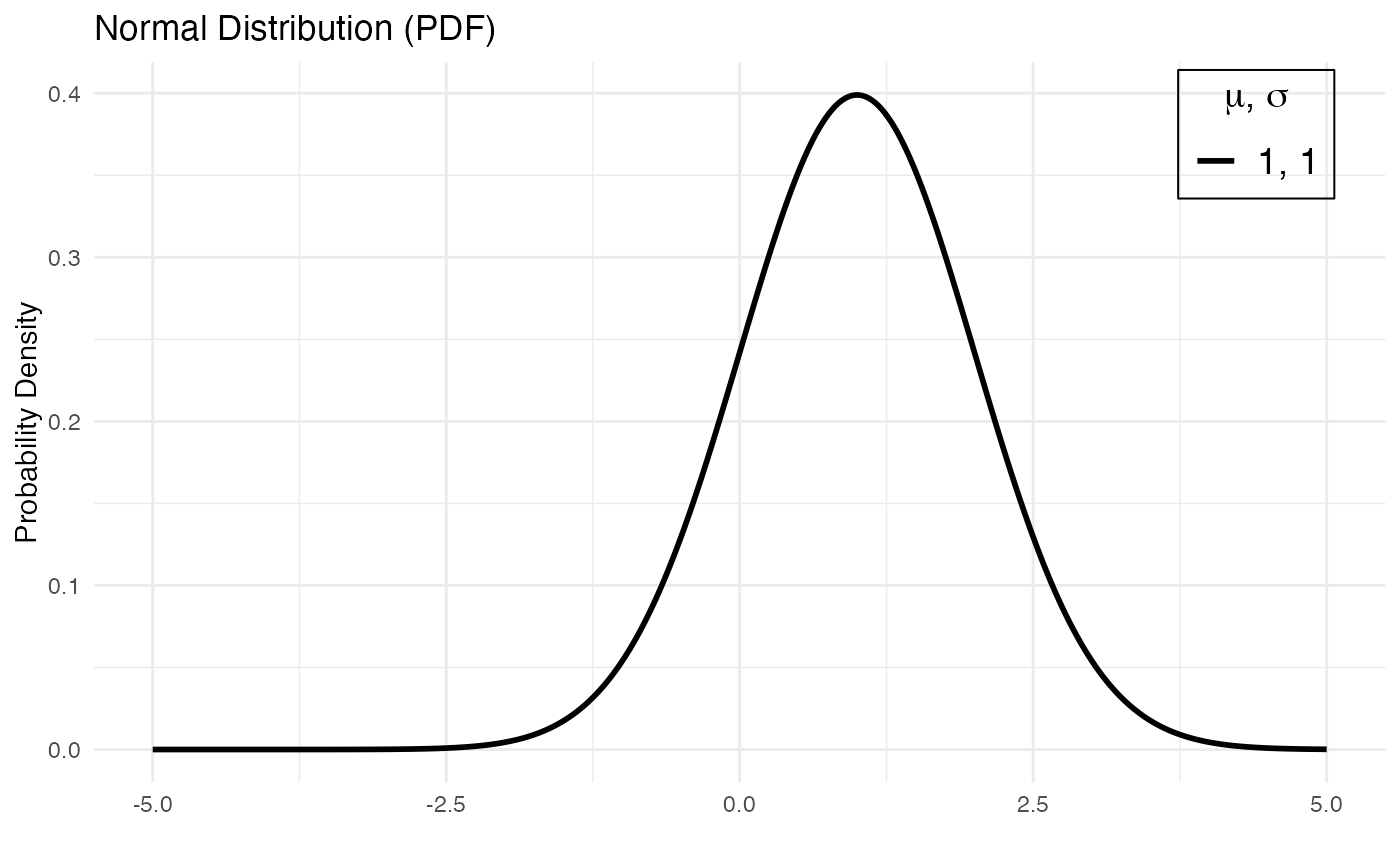
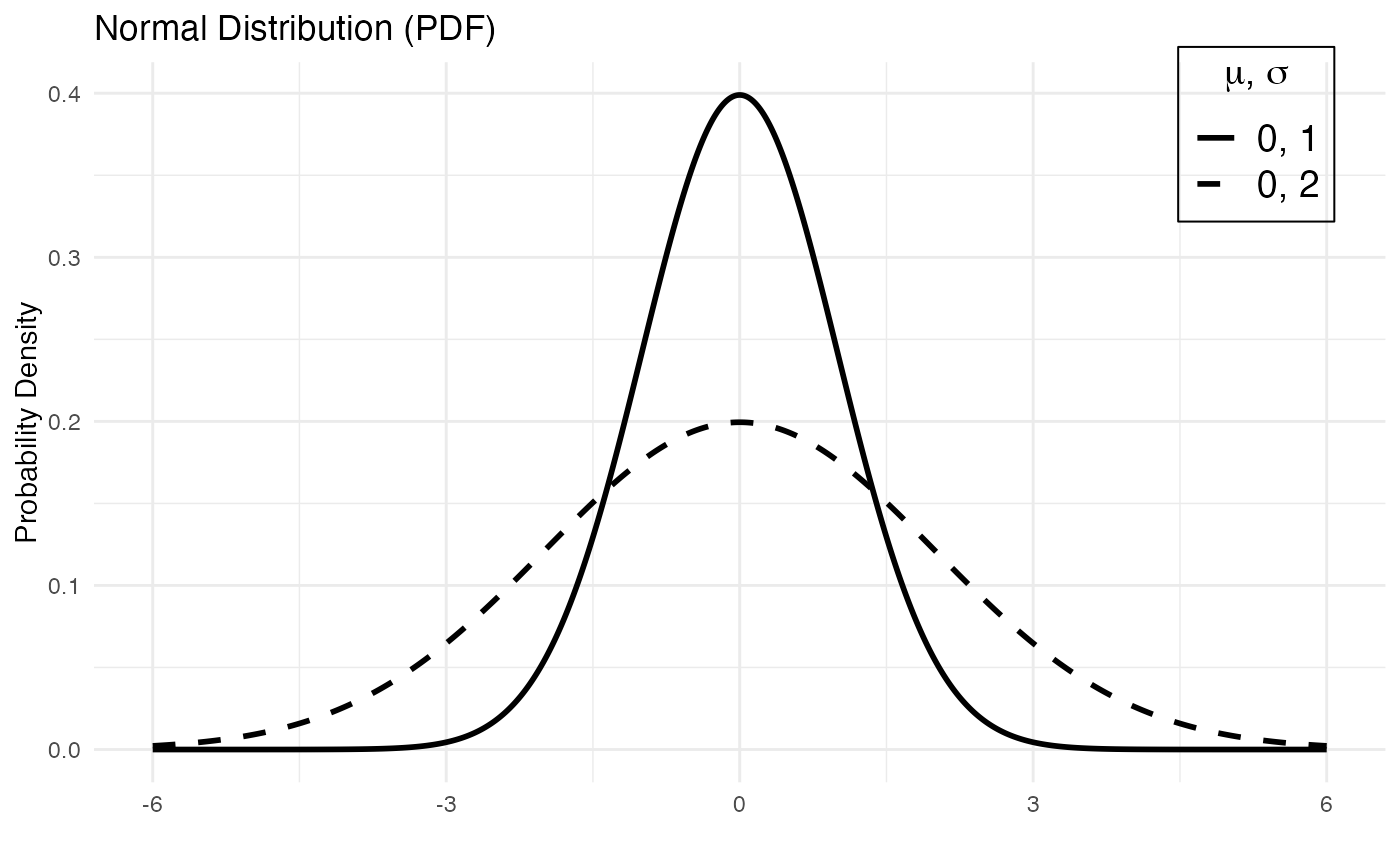
Plotting Probability Density/Mass and Cumulative Distribution Functions
pdplot2.Rd`pdplot2` visualizes probability density (mass) and cumulative distribution functions in R. It requires parameters correctly specified for each distribution.
pdplot2(x, mean, sd, size, prob, rate, lambda, location, scale, shape,
  shape1, shape2, df, df1, df2, meanlog, sdlog, min, max, m, n, k,
  dist = c("normal", "binomial", "exponential", "poisson", "chi-square",
  "logistic", "cauchy", "beta", "gamma", "geometric", "Student's t","F",
  "weibull", "negative binomial", "log-normal", "uniform", "hypergeometric"),
  type = c("PDF", "CDF"),
  show_color = FALSE,
  linetype = ...,
  color = ...)
Arguments
- x
Vector of quantiles
- mean
Vector of means.
- sd
Vector of standard deviations.
- location
Location parameter.
- scale
Scale parameter.
- size
Number of trials (zero or more).
- prob
Probability of success on each trial.
- df
Degrees of freedom (non-negative, but can be non-integer).
- df1, df2
Degrees of freedom.
Infallowed.- lambda
Vector of (non-negative) means.
- rate
Vector of rates.
- shape
Shape parameter.
- shape1, shape2
Non-negative parameters of the Beta distribution.
- meanlog, sdlog
Mean and standard deviation of the distribution on the log scale
- min, max
Lower and upper limits of the distribution
- m, n, k
The number of white balls in the urn, number of black balls in the urn, the number of balls drawn from the urn
- dist
Probability distribution. The supported distributions are "normal", "binomial", "exponential", "poisson", "chi-square", "logistic", "cauchy", "beta", "gamma", "geometric", "Student's t","F", "weibull", "negative binomial", "log-normal", "uniform", "hypergeometric".
- type
Probability density or cumulative distribution functions.
- show_color
If TRUE, pdplot2 uses colors for different distributions. Default is FALSE.
- linetype
A character vector of linetypes. Default line types are c("solid", "dashed", "dotted", "dotdash", "longdash", twodash", "1F", "F1", "4C88C488", "12345678").
- color
A character vector of colors. Default colors are c("#FF0000", "#00A08A", "#F2AD00", "#F98400", "#5BBCD6", "#ECCBAE", "#046C9A", "#D69C4E", "#ABDDDE", "#000000").
References
H. Wickham. ggplot2: Elegant Graphics for Data Analysis. Springer-Verlag New York, 2016.
Karthik Ram and Hadley Wickham (2018). wesanderson: A Wes Anderson Palette Generator. R package version 0.3.6. https://CRAN.R-project.org/package=wesanderson
R Core Team (2020). R: A language and environment for statistical computing. R Foundation for Statistical Computing, Vienna, Austria. URL https://www.R-project.org/.
Note
This function uses only the probability density/mass and cumulative distribution functions in base R (stats package). It also requires ggplot2 package.